'Transport poverty' is a new buzzword. I recommend no longer using this. There is certainly poverty in the Netherlands, because we have food banks and thirty-two thousand 'registered' homeless people, in reality more. Six percent of Dutch population lives below… Read More
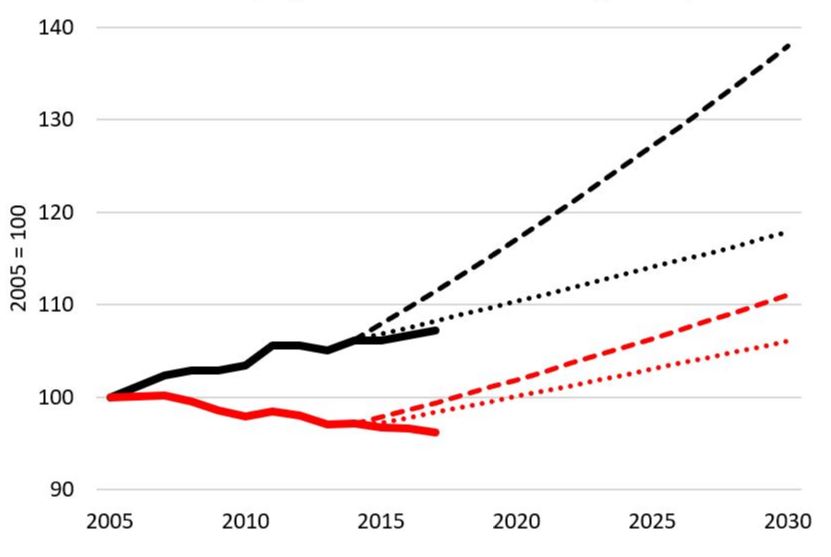
Official data show that the average Dutch inhabitant rides now 4% less in cars, than in 2005. See the solid red line in the graph. This reflects the sum of kilometers as driver and passenger. Car traffic has increased by around 7% in the same 12-year period. The solid black line. Population growth and a lower car occupancy explain the difference between car mobility and car traffic. The average occupancy of cars has decreased from 1.5 to 1.4 in this period.
The dotted lines in the graph show the official government projections from 2014 till 2030 for both car mobility and car traffic. The projections are not consistent with the changing mobility patterns of the Dutch population (the red lines). Furthermore, the low projection for the growth in car traffic is in line with current developments, while the Government bases decisions on increasing highway capacity on the unrealistic high growth scenario (black lines).
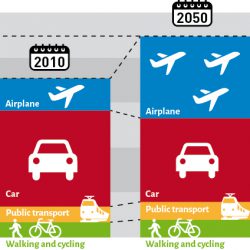
In my book New Mobility, I explain the stabilization of car mobility. Main reason is that the average speed of the car did not increase any futher in Western-Europe since around 1995. The new urbanization reduces car mobility somewhat. Finally, because air travel grows so fast, people spent a little less time driving cars.
Further reads